Read about Dr Chris Gibson's bioabundance surveys for the Chattowood housing development.

Measuring the rainfall at The Beth Chatto Gardens
The rainfall at Beth Chatto's has been measured continuously since 1953. Initially, it was recorded as a practical tool for the Chatto fruit farm monitoring how much rainfall the trees were receiving. Measurements taken now are used to inform the work in the garden; knowing how much water our unirrigated Gravel Garden plants are expected to receive and when has helped to guide plant choices. The combination of a very free-draining soil and low rainfall means only the most drought-resistant of plants are likely to survive here.
Recording rainfall for consecutive years can educate us about fluctuations from year to year, helping us to prepare accordingly as we understand nature’s patterns. Most importantly, it guides us with planting times. For example, April tends to be a dry month for us here, so we try to do as much of our spring planting before then to ensure plants get the best start and require minimal irrigation. (Our new plantings in the Gravel Garden are watered in at the time of planting, but after that, they are on their own!)
When Beth and Andrew built the house in 1960 and began developing the garden, the rain gauge was moved to its present location in the Scree Garden (back then, it was Beth’s original dry, Mediterranean Garden) close to the house where it remains to this day. Being in the same position for all these years means that records are consistent, and the rain gauge is easily accessible.

Collecting rainfall
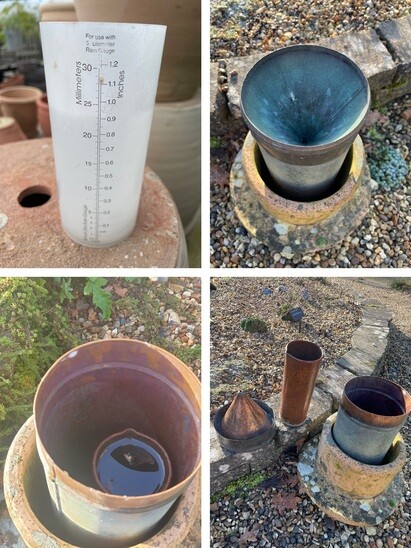
The gauge itself is a 5-inch (127mm) copper barrel with a funnel top that drips down into a collection beaker. We pour the collected water into a calibrated measuring tube to gather the results which are then logged on a spreadsheet. The measuring tube used to be made of glass but is now a more practical plastic measure.

Recording the data
The rainfall gauge has always been checked and recorded once a week. At first, Beth recorded the monthly total in inches, splitting the record into two seasons; Winter (October to March) and Summer (April to September) giving a total for each season which was added together to give the yearly figure.
These totals used to be kept written on a chart hung on a cupboard door in Beth’s utility room before later being transferred over to the computer! Unfortunately, some of the written sheets have been mislaid, resulting in a lack of reliable data from 2001 until 2011. Hopefully, they will come out in the wash one day!
Nowadays, the rainfall is logged on a weekly basis, so we have the option to view the rainfall seasonally or annually.
Alongside the rainfall, we also keep an entry of notable weather, such as snow, heavy frost, or periods of extremely high temperature.
Analyzing the data
The average annual rainfall in the garden is 500mm/20inches.
When looking back through the original Winter / Summer record (1953 - 2011) our lowest recorded rainfall was:
Winter 1973 / Summer 1974 - 230mm / 14.04inches.

The highest recorded rainfall was:
Winter 2000 / Summer 2001 with 637mm / 38.9inches
On the new annual record with weekly/monthly entries (2011 onwards), the most rainfall we received was in 2014 with 832mm / 50inches. At the other extreme, in the Summer of 2018, we had 50 days without any rainfall!

Written by Gardener Scott

COMMENTS